
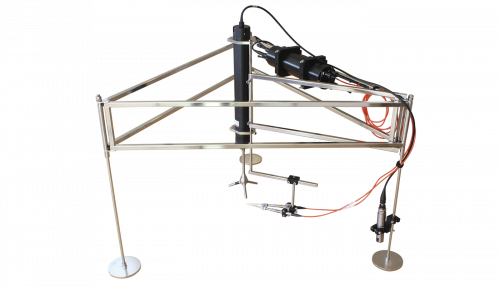
Time/signal synchronization
When using a Clark type sensor, getting the signal sampling synchronised with the Nortek vectors 64 Hz velocity signal is not a trivial task. In the Unisense EC system the continuous signal from the sensor is sampled with a 10 kHz frequency. This needs to be logged at the same time as a velocity signal from the vector is logged. This we accomplish by letting the vector control the datalogging with a Sync signal out and then converting the analogue signals to digital signals with a 16 bit resolution with oversampling.
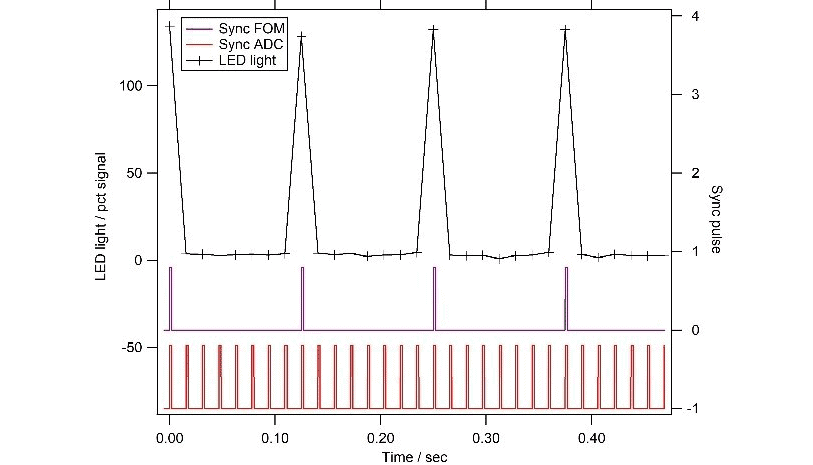
The result is that the analogue signals are stored every time a syncing signal from the vector is received with a 64 Hz frequency which provides a data set that samples well below the response time of the sensors. This is shown in Figure 1.

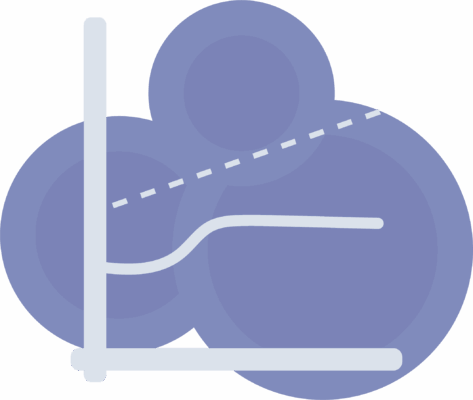
Adding the optical sensors is not trivial either since the readout of the optodes must be conducted at the same time as the sync signal is received from the vector. Since flashing the optode with a 64 Hz rate will not be possible due to a rapid bleaching of the sensor dye, the flash rate needs to be slower. By letting the flashing of the optode also be controlled by the sync signal from the vector and then collect data at either 4, 8 or 16 Hz (sub divisions of 64) we can still sample fast enough in terms of the sensor response time and not wear out the optode too fast. This is illustrated in Figure 2.
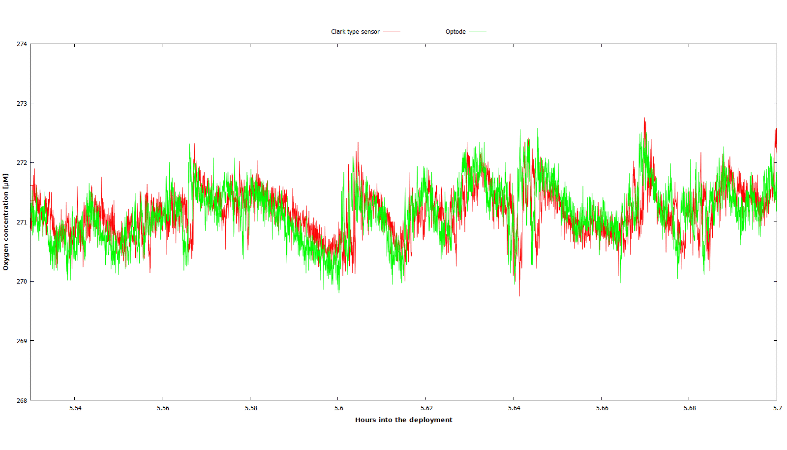
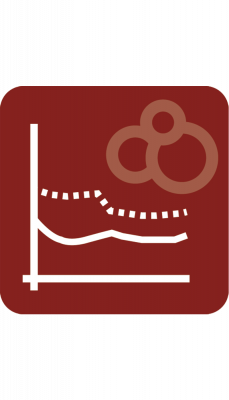
The flashing frequency of the optode can be adjusted before deployment. This allows the system to use both types of sensors with similar results – this is illustrated in Figure 3.
System and Signal noise
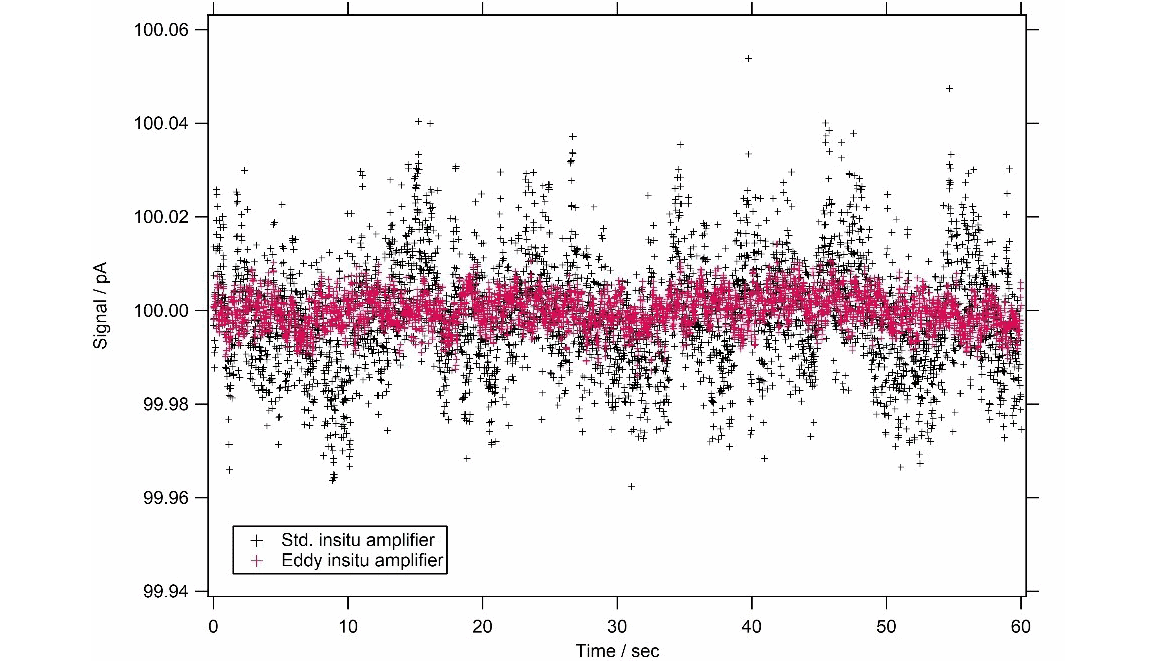
A sensor signal with electronically introduced noise will interfere with the calculated fluxes. This noise on the sensor signal can come from multiple sources, mainly from the other electronic components in the system. While standard filtering techniques can get rid of most of this noise, we have developed our own solution to this problem. We have implemented a unique signal handling mechanism, that will get the noise level down to ~0,01 pA on the sensor signal. For our standard in situ amplifier this is normally around 0,1 pA. The difference and size of the noise level can be seen in Figure 5.
Eliminating the noise will remove a significant source of data artefacts. The low noise floor on the EC in situ amplifiers together with the very high sampling rate allows you to focus on the oxygen fluxes and concentrations and not on system noise.
Data storage
All data is stored on our datalogger. The datalogger has enough internal storage to allow for deployments lasting multiple days. The longest possible deployment is determined by the number of extra batteries that is added to the system. The datalogger itself will run for ~20h on the internal battery, while each extra battery will add an additional ~40h. Throughout these long deployments all data is perfectly synchronised and does not contain phase shift artefacts.
Data handling
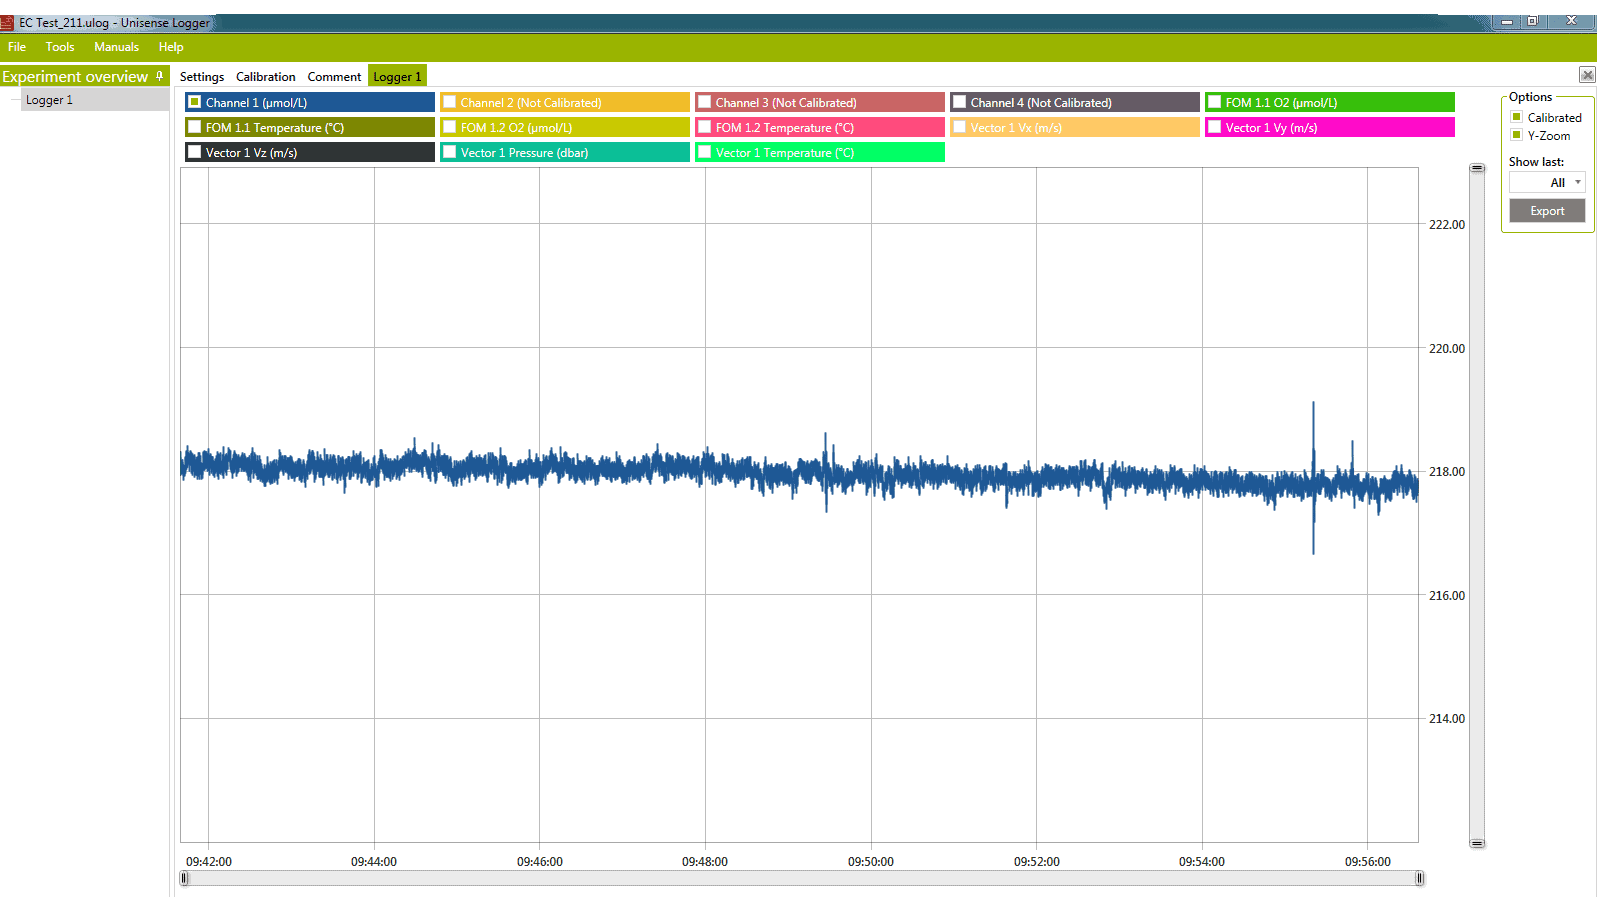
All data handling actions are now initiated via the SensorTrace Suite Logger. This includes pre-deployment calibrations and postdeployment visualisation. With this workflow it is easy to perform multiple calibrations and apply these to the relevant datasets. You can also choose between different temperature probes for automatic temperature compensations of the optical sensors. If the system is deployed with a communication cable, all data from all sensors will be available for live inspection.
After the deployment, you can download the complete data set from the datalogger and then apply calibrations and temperature compensation before you export it to CSV files for further data treatment, either in the supplied EddyFlux tool or in your own scripts/programs.
The EddyFlux tool also allows for establishing the time lag between an eddy measured in the ADV detection volume and until it reaches the sensor. It can also be configured to a user specific window for running averages and linear detrending oxygen concentration calculations.
Additional sensor
Besides the typical oxygen sensors, we can also offer a fast responding H2S sensor. We designed the system to accommodate other types of sensors, i.e. conductivity sensor from PME. If you want to add another sensor, just let us know and we will do our best to fit it onto the EC system.
Additional uses
The Unisense Eddy Covariance System’s core unit, the Field DataLogger, can be used for two other flux measuring techniques in addition to the EC technique. It will also function as the core unit in the MP4/8 MiniProfiling system and as the core unit in the Chamber Lander system – thus allowing for complementary data sets of flux measurements with one core unit.
Our goal
Our goal with this system is to provide the best possible data set for further data analysis, without a labour-intensive development phase, making sure that you have the freedom to use different configurations to suit your needs, both in shallow and deep sea application now and in the future. Thus, reducing the time from scientific idea to publication.
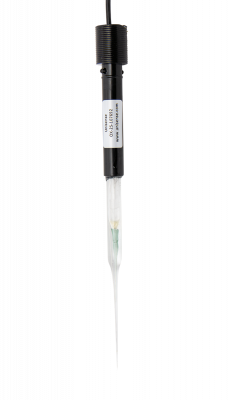
High performance oxygen microsensor
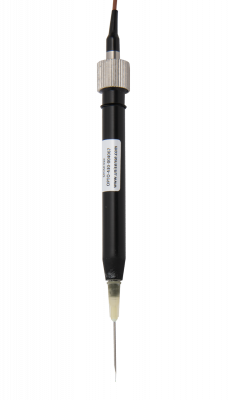
Optical oxygen sensor technology
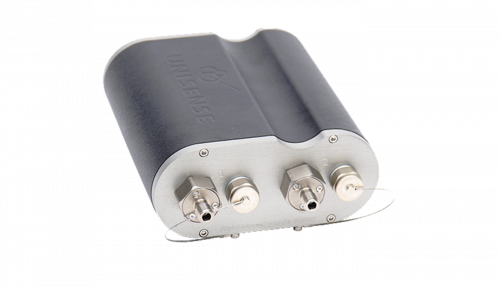
Waterproof MicroOptode amplifier
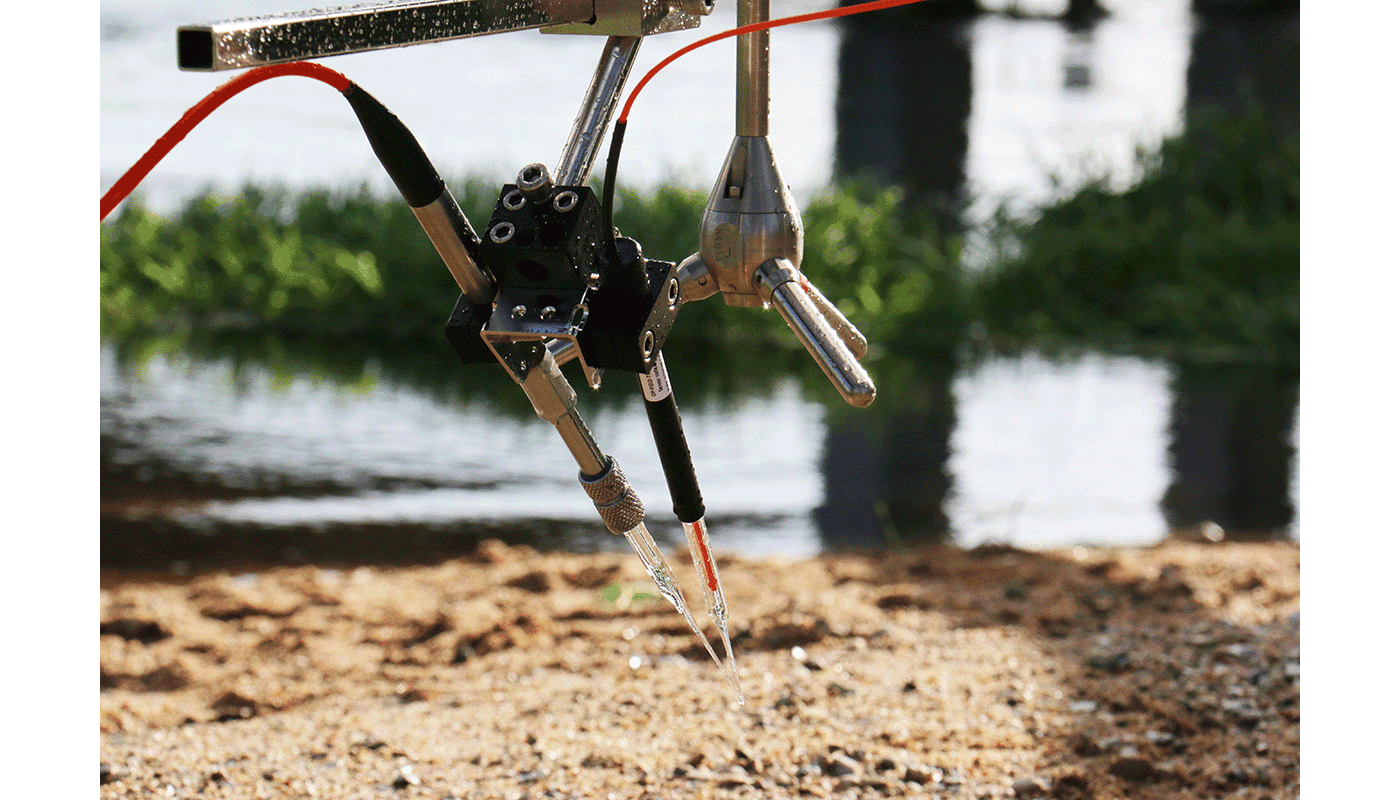
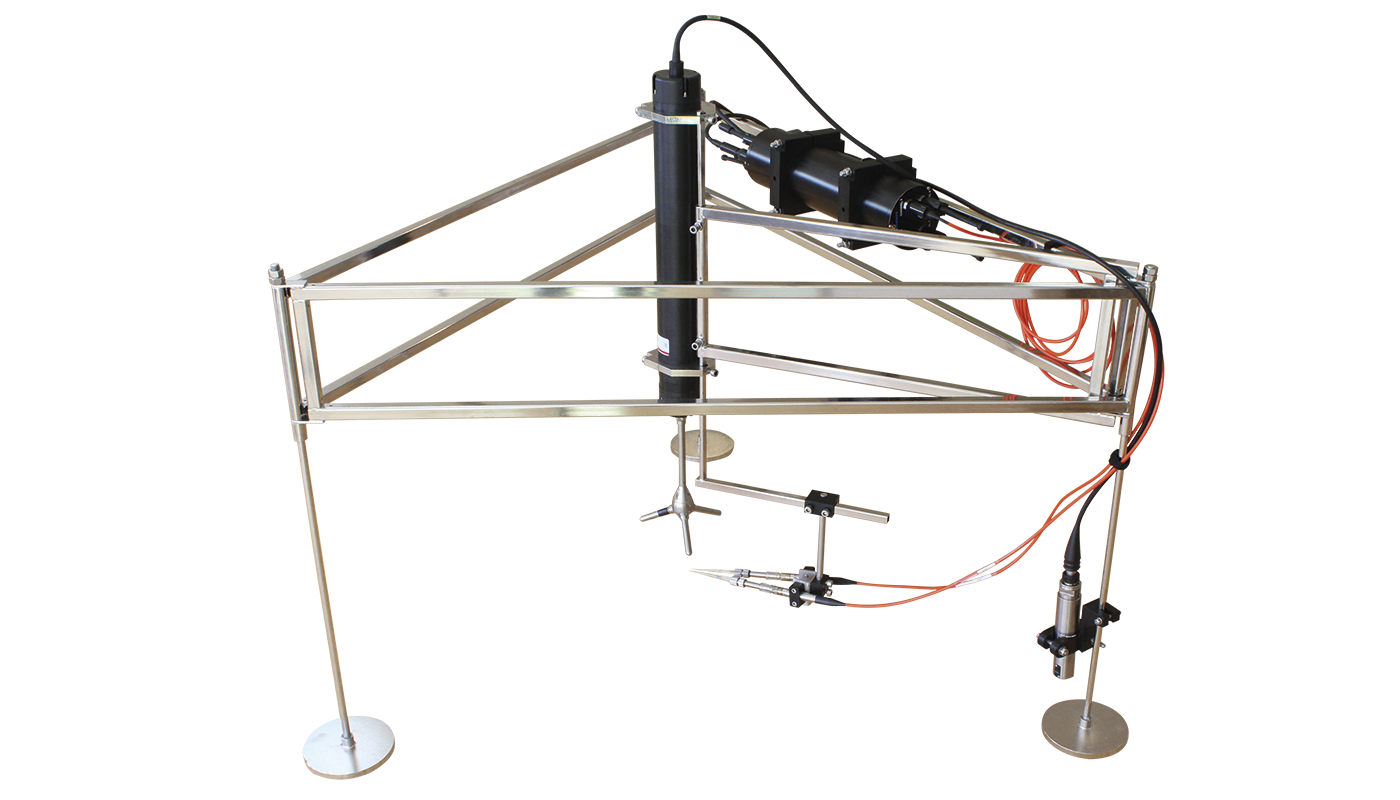
Complete system to study benthic fluxes in aquatic environments
Calibrate your sensors and log time-series data.
Freeware for sensor calibration and data logging. Choose Logger+ to add motor control.
Beckedorf et al. used lignocellulosic biomass and cobalt-loaded carbon nitride to boost photocatalytic hydrogen production
Bang et al. developed a dual flow chamber that mimics the shear stress and anaerobic conditions of the colon
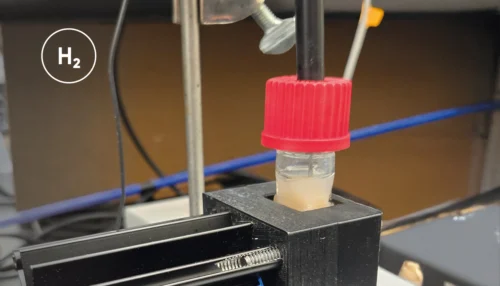
Quantifying the Hydrogen Evolution Reaction using H2 Sensors
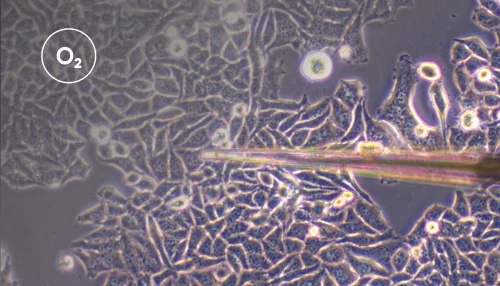
Real-time measurements of oxygen consumption rates in response to 2-deoxy-D-glucose treatment
pH Microelectrode reveals distinct environment inside 3D organoid
Tissue oxygen partial pressure for screening and controlling for variation in ex vivo acute brain slice viability
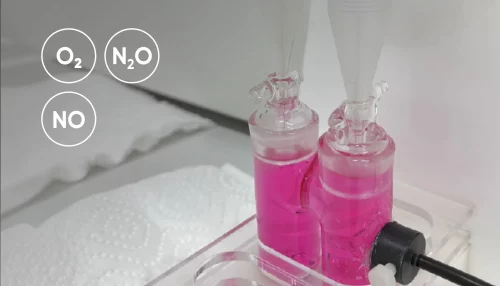
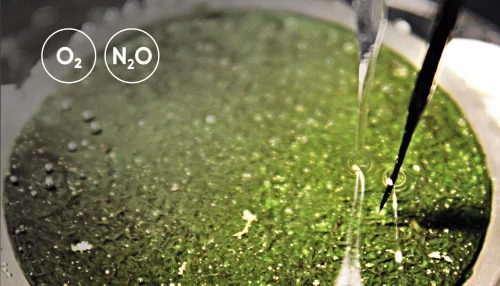
How nitrifying microorganisms are able to produce nitrous oxide through denitrification
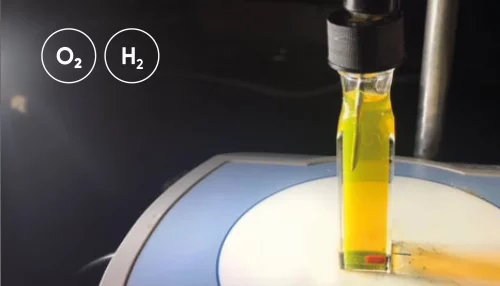
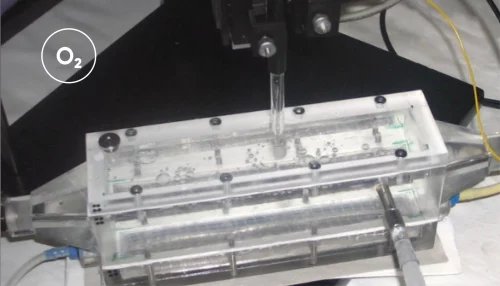
Hydrogen and oxygen microsensors for direct and real-time detection of dissolved gas in photocatalytic/electrochemical studies
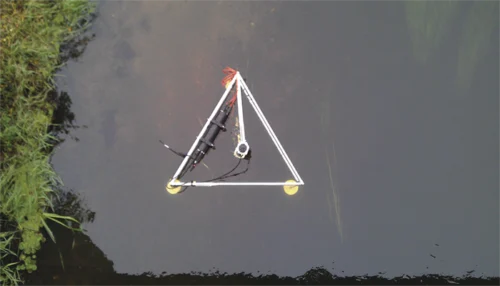
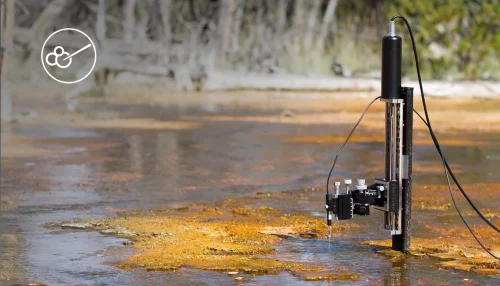
The Eddy Covariance system and how to get high quality data from long term deployments with multiple sensors.
Learn in the laboratory - explore and confirm in the field!
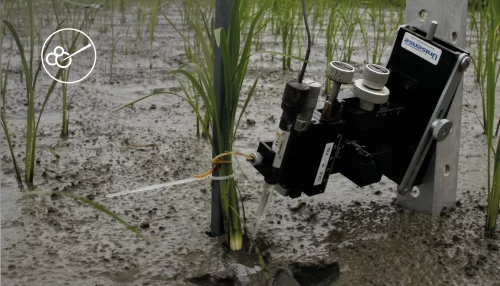
Leaf gas films are hypothesized to improve internal aeration of the plant during the day
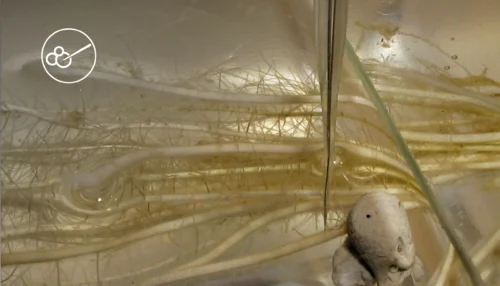
How to quantify the consumption rate of oxygen as well as the oxygen exchange rate across the water - sediment interface
Mitigation of N2O Emissions from Wastewater Biofilms
The use of oxygen microelectrodes to study nitritation biofilms with different geometries
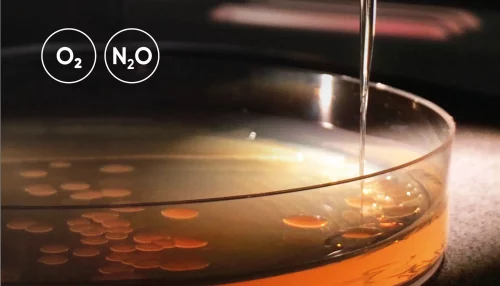
O2 and N2O microprofiles in sputum samples from cystic fibrosis patients with chronic Pseudomonas aeruginosa lung infection